General engineering guidance for technical review. Examples explain the method and do not establish specifications for a supplied product.
1. Define the pressure budget
Differential pressure is the upstream pressure minus the downstream pressure between two specified measurement points. It is not the same as the static pressure inside the housing. A high-pressure process may have a small allowable filter pressure loss; a low-pressure installation may still overload an element if blockage or a transient creates an excessive differential pressure. Record operating pressure, normal differential pressure and the approved element differential-pressure limit as separate quantities.
Draw the pressure taps on the process sketch. A reading across the entire assembly includes inlet, outlet, support and housing effects as well as the filter medium. If a proposed test curve covers only the medium, reserve a separate allowance for the remaining flow path before using that curve in the system balance.
2. Understand the clean-flow model
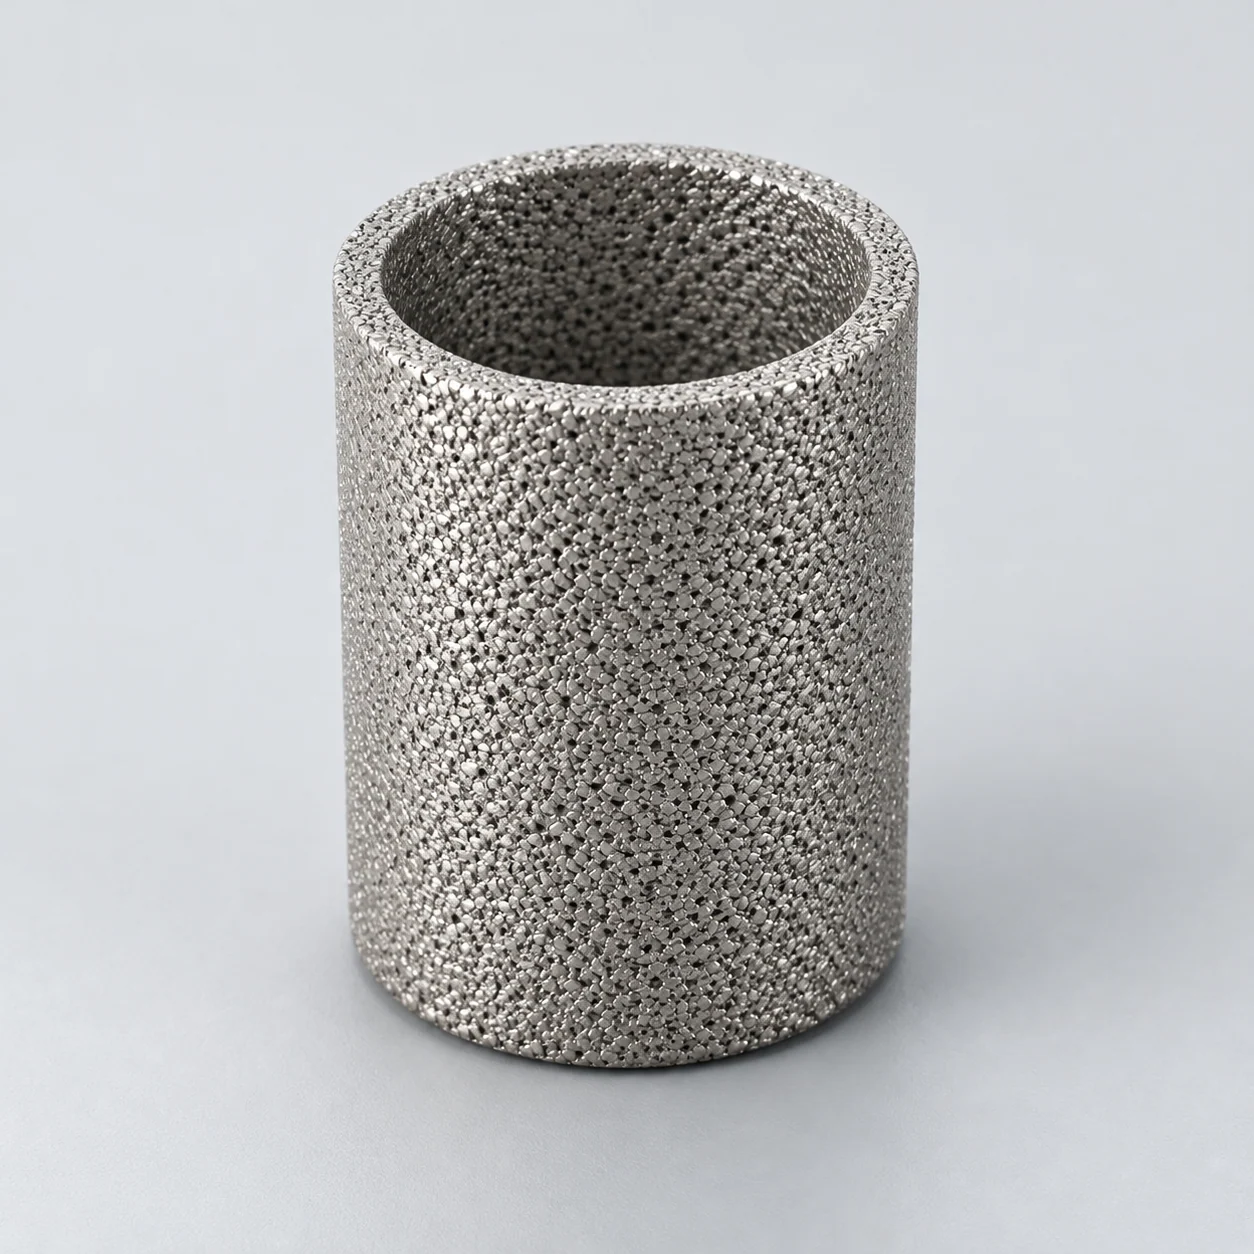
For a clean, fully saturated medium in a viscous, approximately one-dimensional liquid-flow regime, the Darcy model gives Δp = μLQ/(kA). Here μ is dynamic viscosity, L is flow-path thickness, Q is volumetric flow, k is permeability and A is the area normal to flow. Using Pa·s, m, m³/s, m² and m² respectively gives pressure in Pa. The expression explains a trend; it does not supply an unknown permeability.
Darcy–Forchheimer behavior describes this pressure-gradient relationship; ISO 4022 addresses viscous and inertial permeability measurements for interconnected sintered porosity. If a measured curve bends upward with increasing flow, do not keep extending a straight-line fit. Ask for the tested operating range and an appropriate model for that range.
3. Make a conditional comparison
Example calculation, not a product rating: suppose a clean test element loses 0.10 bar at 10 L/min with a liquid viscosity of 1 mPa·s. For the same geometry and permeability, the viscous model predicts 0.40 bar at 20 L/min and 2 mPa·s: 0.10 × (20/10) × (2/1). This is an arithmetic sensitivity check, not a validated operating point.
The comparison fails if inertial losses, a changing liquid structure, partial wetting or retained solids matter. Temperature belongs beside viscosity because a room-temperature water curve cannot automatically describe a process liquid at startup. Request viscosity at the relevant temperatures rather than applying a generic correction factor to every fluid.
4. Check which area is being quoted
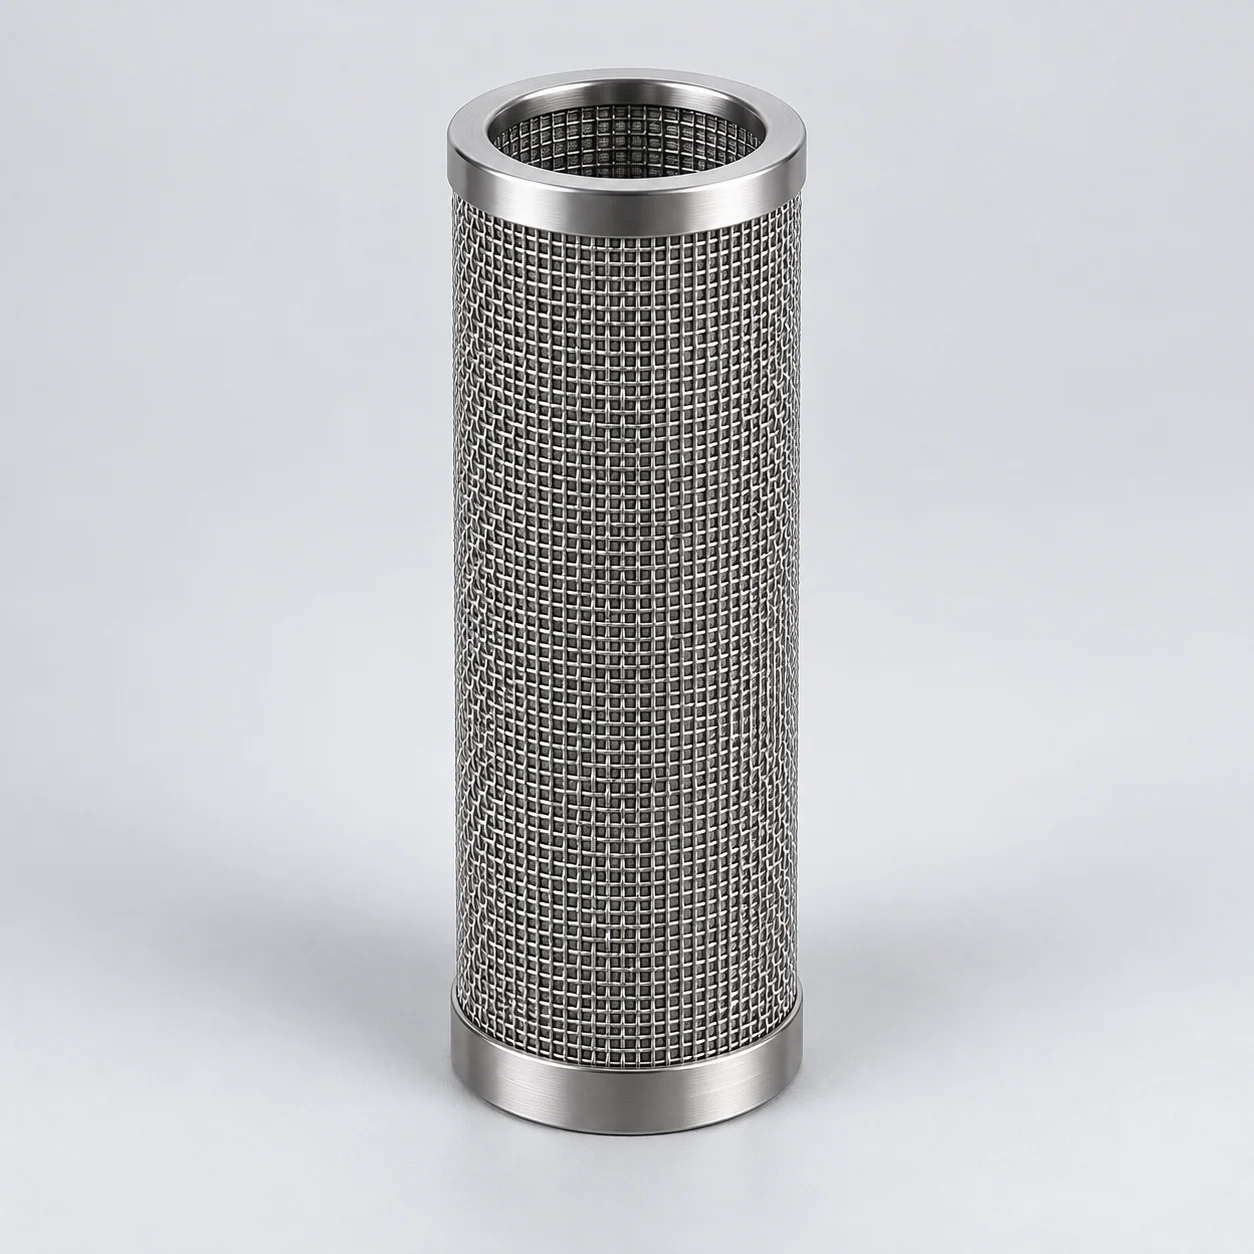
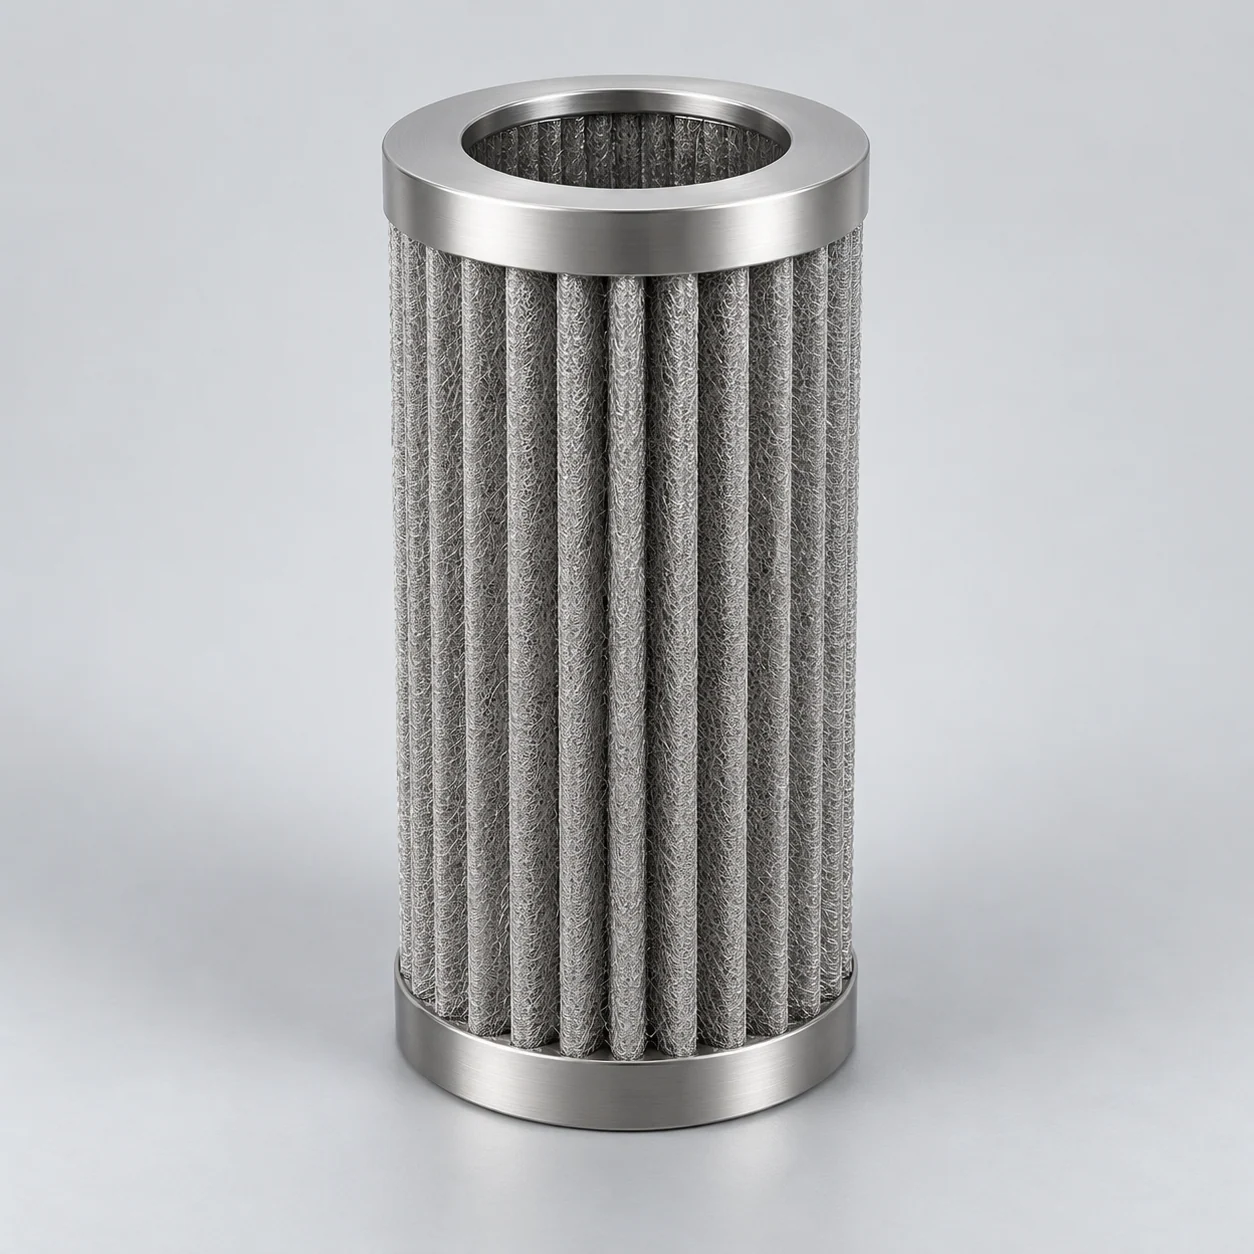
A cylindrical envelope area and the unfolded area of a pleated medium describe different geometries. Request a definition of active filtering area, sealed ends, blocked regions and support contact. For a plain cylinder, the nominal lateral area πDL is only a geometry calculation; it is not proof that the whole surface contributes equally to filtration.
At equal flow, increasing genuinely active area lowers superficial velocity Q/A. That observation helps frame a comparison, but doubling the catalog area does not prove that the complete assembly pressure loss halves. Pleat spacing, internal passages and nonuniform loading can affect usable performance. Compare complete elements with the same operating conditions and measurement boundaries.
5. Separate clean resistance from loading
A clean curve establishes the initial hydraulic condition. During service, deposits can add resistance within the medium or form a cake on its surface. Particle characteristics, solids concentration and viscosity are therefore essential sizing inputs. A clean-water measurement cannot predict an operating interval for an unknown slurry.
Track flow and temperature with differential pressure. At controlled constant flow, increasing resistance can appear as increasing pressure drop; at controlled pressure difference, it can appear as decreasing flow. A useful trial records the outlet quality and solids loading as well, so that a longer run is not mistaken for better performance when retention has changed.
Sintered metal filter pressure drop: what to specify
Request a curve or test series for the proposed element with the fluid, temperature, viscosity, flow direction and pressure-tap locations stated. Identify whether the curve is measured, calculated or transferred from a related configuration. Keep clean acceptance, the maintenance trigger and the mechanical limit distinct. The maintenance trigger must not be inferred from a competitor’s catalog.
For a development order, agree the evaluation range and the decision to be made at each stage: fit confirmation, clean hydraulic performance, particle-control result, loading behavior and recovery after an approved cleaning cycle. Keep the drawing revision and test-object identity with the results. That record makes a later change in area, support or end fitting visible to the reviewer.